Pantheon, Rome

The Pantheon is a Roman temple and archaeological site located in Rome, Italy. Designed by architect Apollodorus of Damascus, the structure dates to the 2nd century and stands 43 meters high with a length of 35 meters. It is a minor basilica and a secularized religious building dedicated to Mary. Recognized as an Italian national heritage site, it is one of the most looked-up sights in Italy. In 2022, the site recorded about 4.9 million visitors.
Planning a visit
The climate in Rome features distinct seasonal changes. Summer months, particularly July and August, see daily highs of 30 °C and relatively low rainfall, with 22 mm and 29 mm respectively. Winter and autumn months bring cooler temperatures and higher precipitation, with November recording about 110 mm of rain. Visitors arriving by air can use Ciampino–G. B. Pastine International Airport, which is located 15 kilometers away. The site is situated 1 kilometer from the center of Rome.
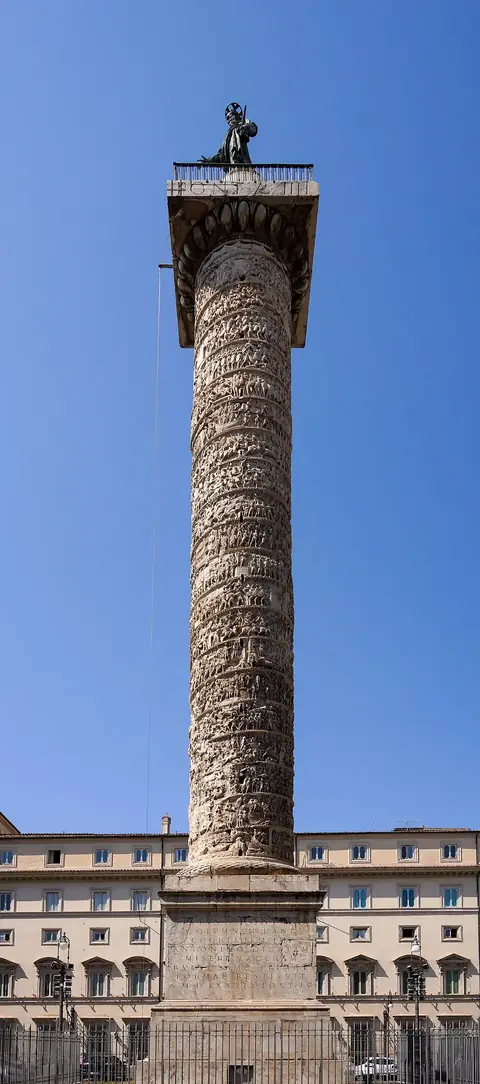
Travelers can combine a visit to the Pantheon with several nearby points of interest. The Santa Maria sopra Minerva church is 0.1 kilometers away, and the San Luigi dei Francesi church is 0.2 kilometers away. Piazza Navona and the Fontana dei Quattro Fiumi are within 0.3 kilometers, and the Column of Marcus Aurelius is located 0.4 kilometers away. The site is wheelchair accessible. It is open Monday through Saturday from 08:30 to 19:15, and on Sunday from 09:00 to 17:45. An entrance fee is required, costing 5 euros for visitors 25 years old and over, and 2 euros for those under 25.
Weather by month
The warmest month is July, with an average high of 30 °C. The wettest is November, with about 110 mm of rain.
| Jan | Feb | Mar | Apr | May | Jun | Jul | Aug | Sep | Oct | Nov | Dec | |
|---|---|---|---|---|---|---|---|---|---|---|---|---|
| Average high, °C | 12 | 12 | 15 | 18 | 22 | 26 | 30 | 30 | 26 | 21 | 16 | 13 |
| Average low, °C | 4 | 4 | 6 | 9 | 13 | 17 | 20 | 20 | 17 | 14 | 9 | 6 |
| Rainfall, mm | 65 | 65 | 56 | 73 | 51 | 30 | 22 | 29 | 70 | 102 | 110 | 97 |
| Rainy days | 11 | 9 | 10 | 8 | 11 | 7 | 3 | 6 | 9 | 11 | 13 | 11 |
Temperatures and rainfall: 1981–2010 averages for this spot (4 km grid), from CHELSA. Rainy days: 2015–2024, NASA POWER.